P100 · INDEX

Wallace
Adeleye

Business operations · Analytics · Automation

Six things I built. Three of them you can try for yourself.

  1. 02Ford, in numbersWhere it started
  2. 03The deal modelFinancial modelling
  3. 04Try itLive, in your browser
  4. 05London, rankedData analysis
  5. 06Run like a teamOperations
  6. 07The IT health checkService design
  7. 08Carnival sound mapOffline by design
  8. 09Investor sign-upMarketing funnel
  9. 10How I workAnd how to reach me
Background

Ford Dunton.
Two years in.

2+ YRSFord Dunton via Expleo, Connected Vehicle programmes
£3M+Budget decisions backed by my reconciliation and reporting
BI + VBAPower BI dashboards, Excel VBA and macros

Spend-vs-target reconciliation, budget administration, data management and visualisation, and training documentation written for engineers from their first week to senior level.

Case 1 · Financial modelling

A deal model that became a product.

13Linked tabs
1,760Live formulas
0Errors on recalculation

Problem

Every property deal was analysed by hand in a new spreadsheet, so results weren't comparable and nothing was reusable.

What I built

  • An Excel model: scenarios, rent-offer grid, break-even rates, scorecard
  • A Python builder that makes the workbook from one config file
  • A What If tab and Power BI tables

Result

It reproduced the original analysis to the penny.

Every new deal now starts from one tested model.
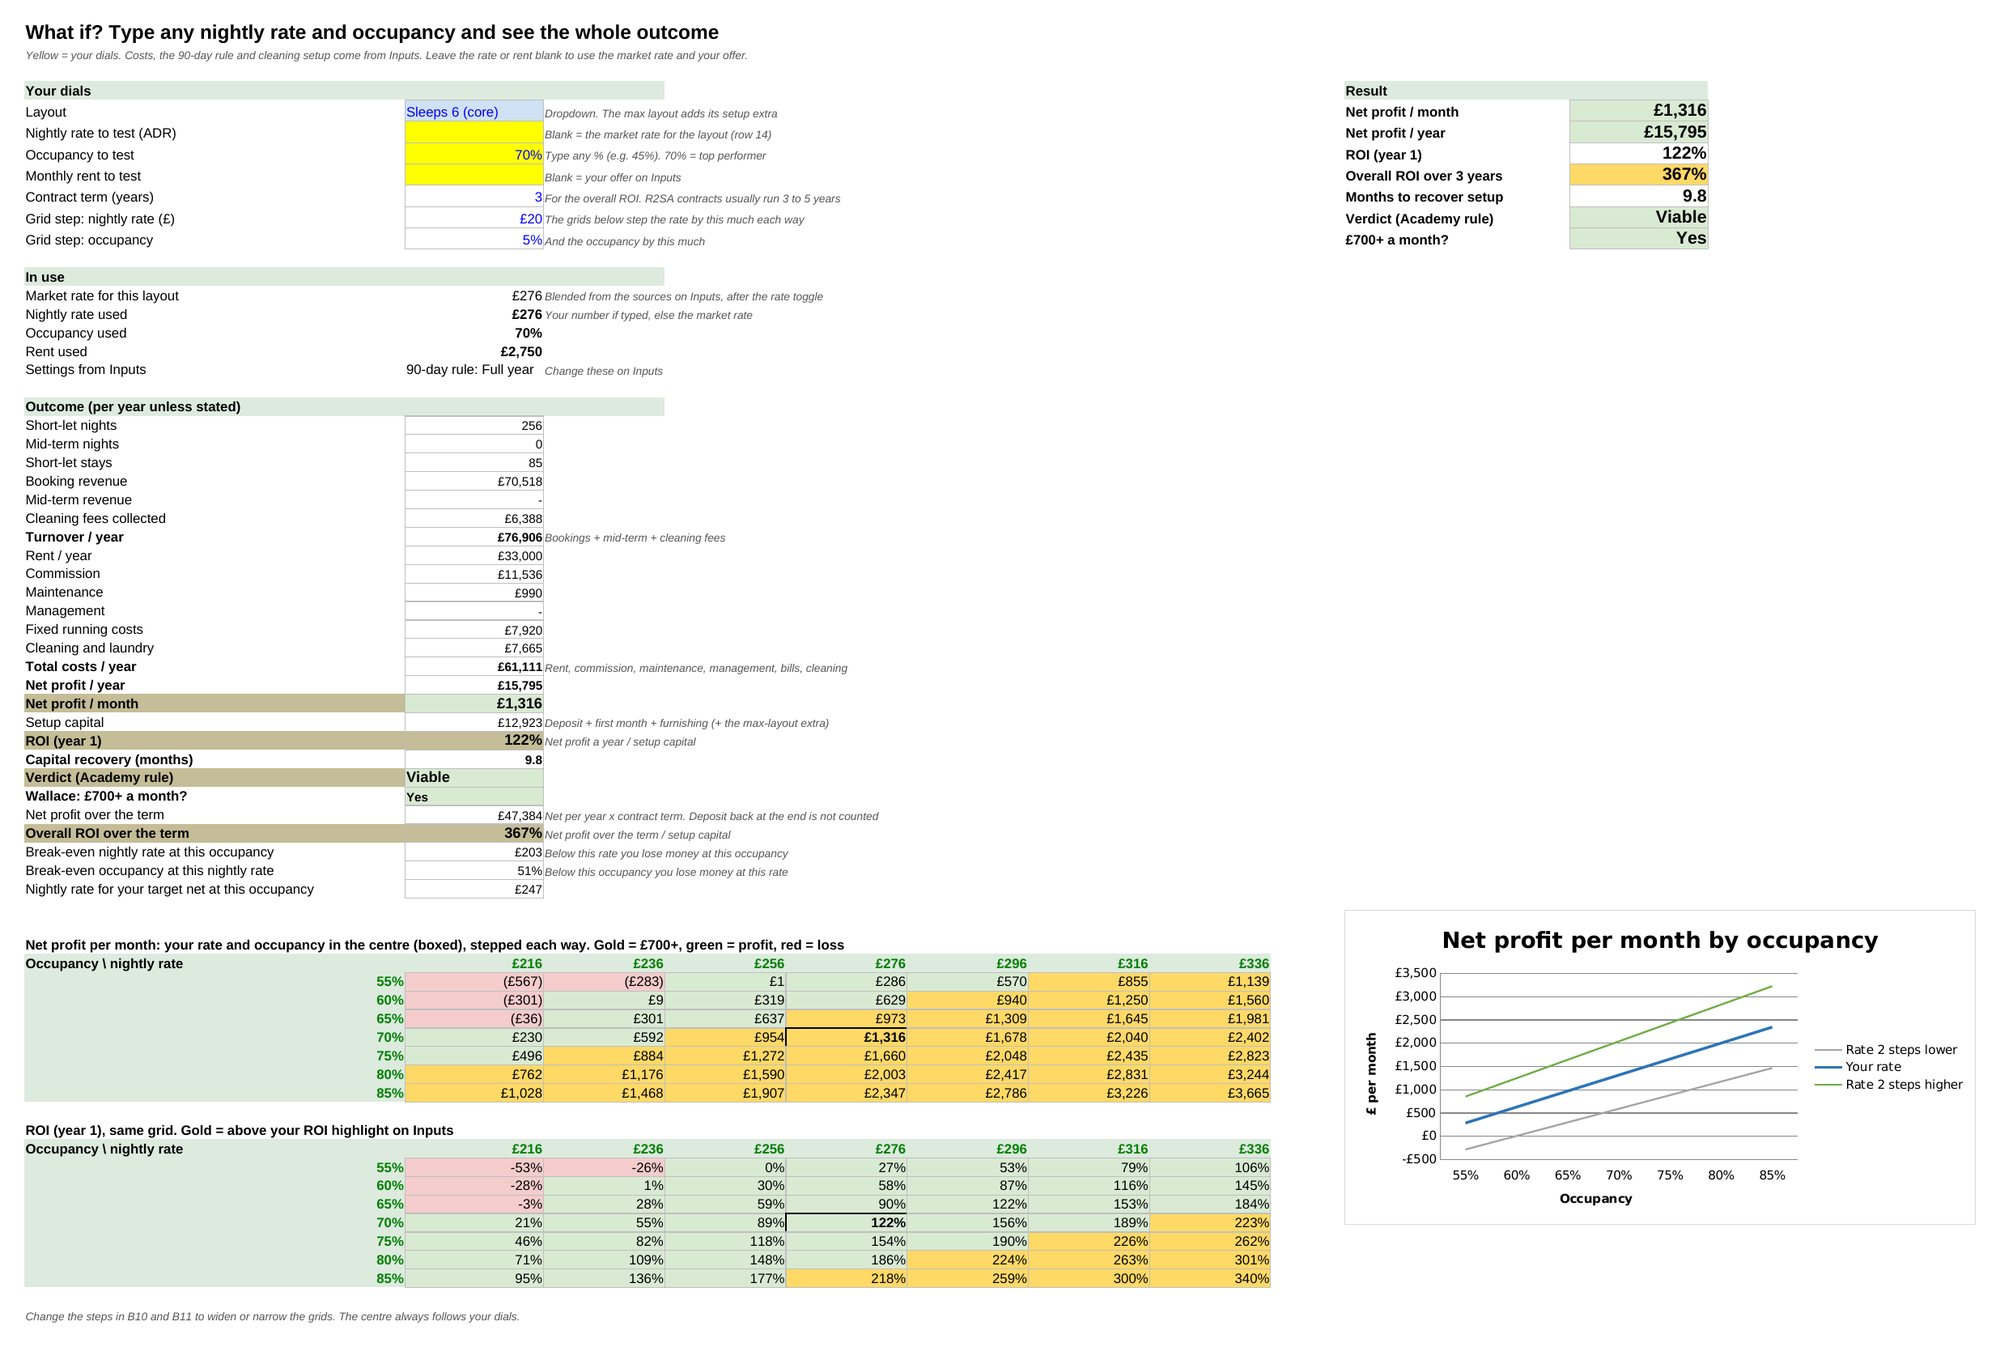
  • The What If tab: input dials, a result box with net profit, ROI and payback, and a profit grid by nightly rate and occupancy.
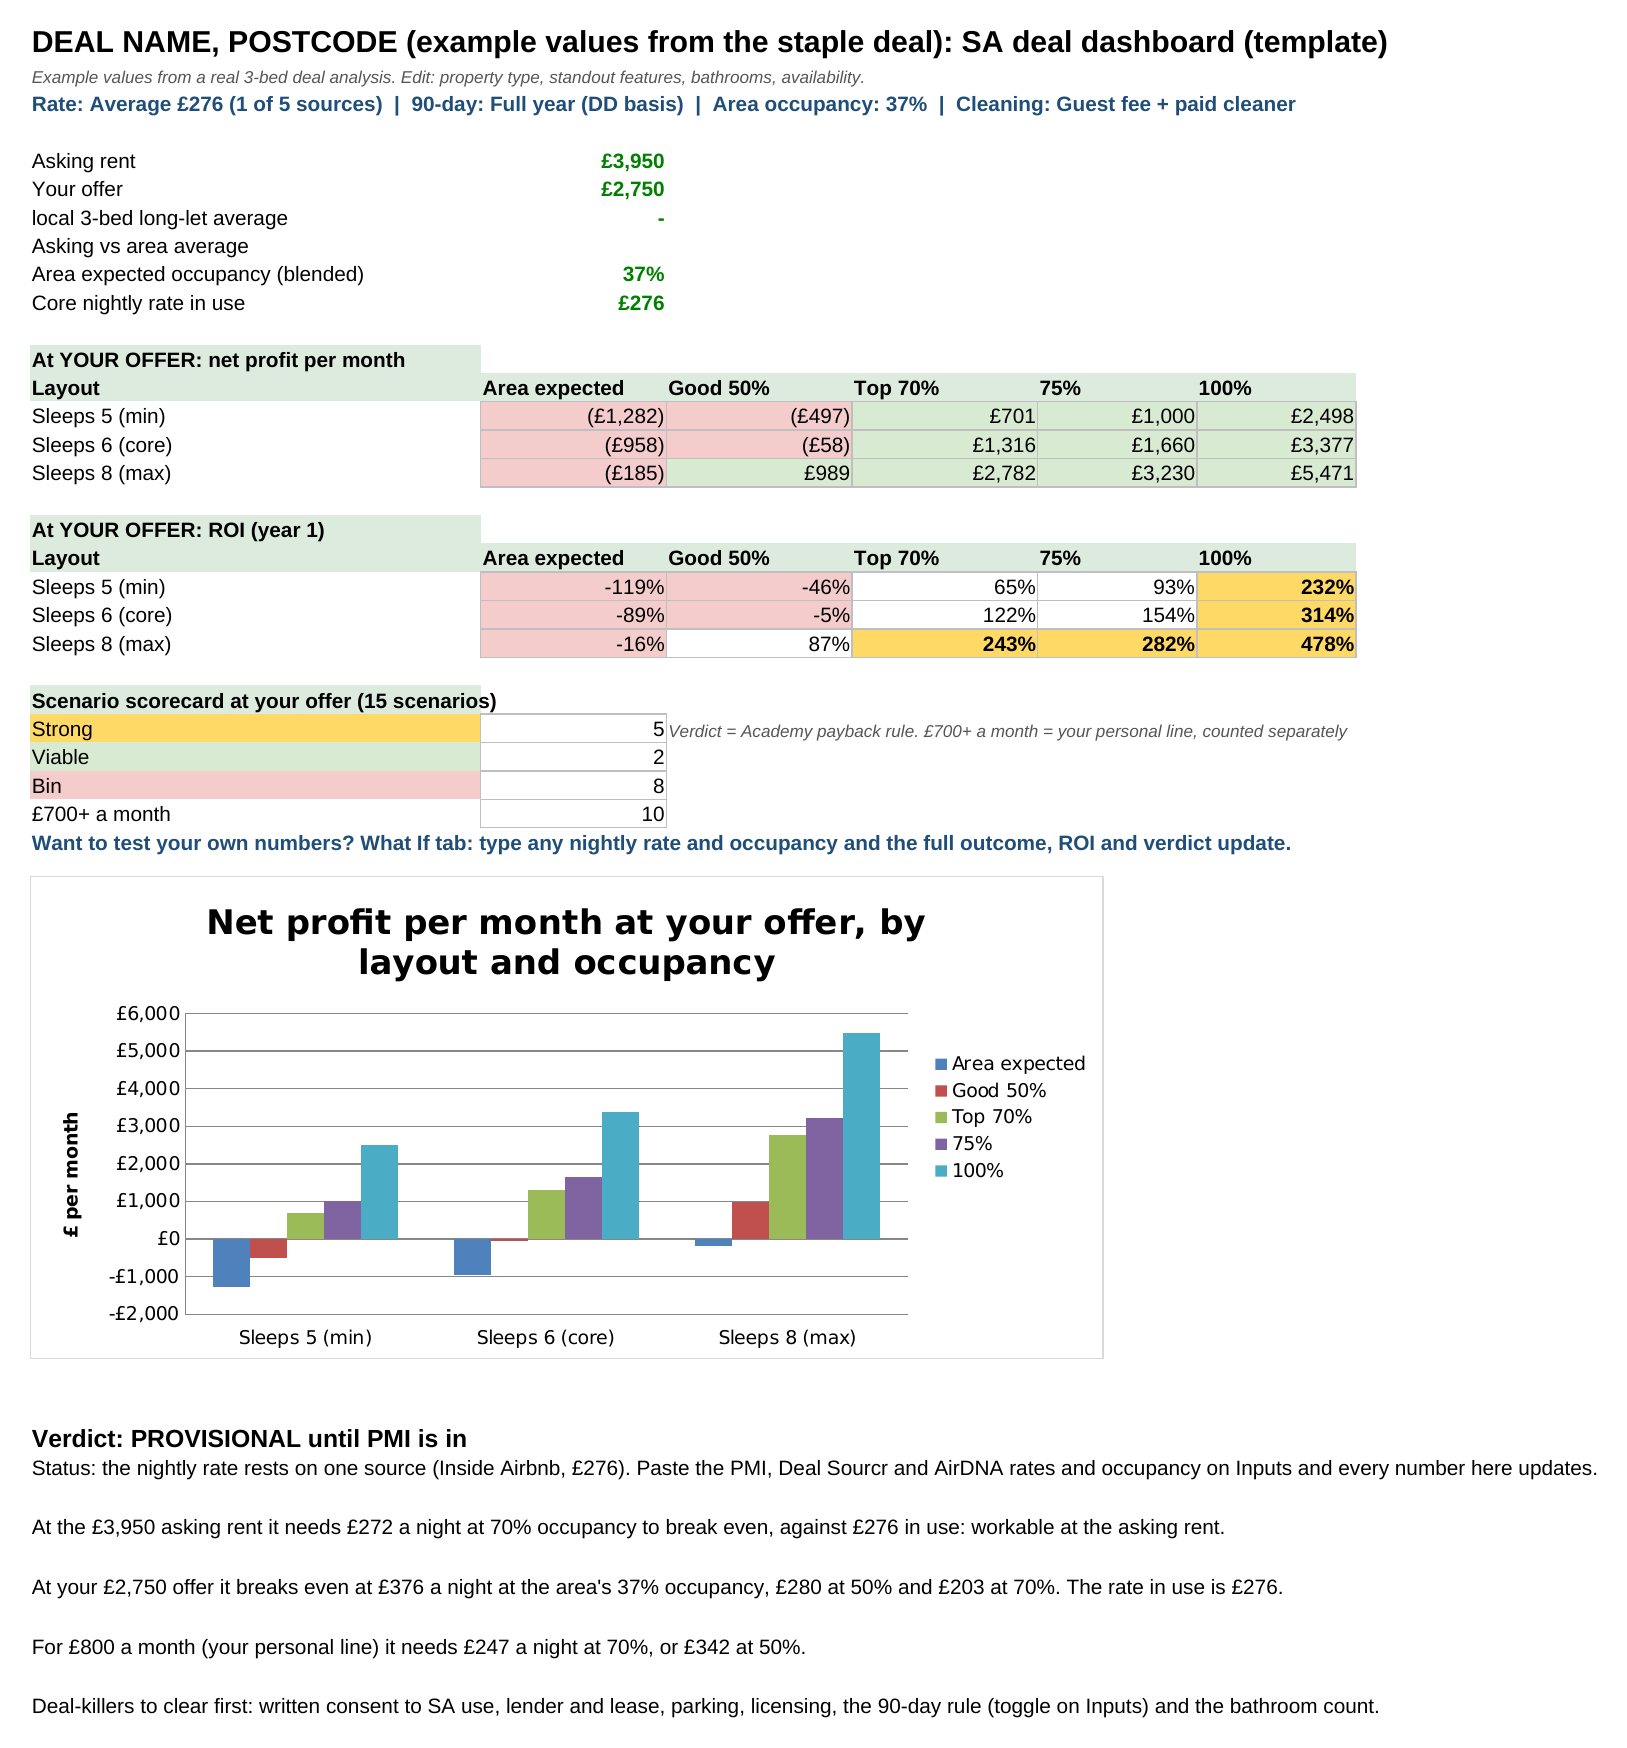
  • The summary dashboard: net profit and year-one ROI by layout and occupancy, a 15-scenario scorecard, a profit chart and the written verdict.
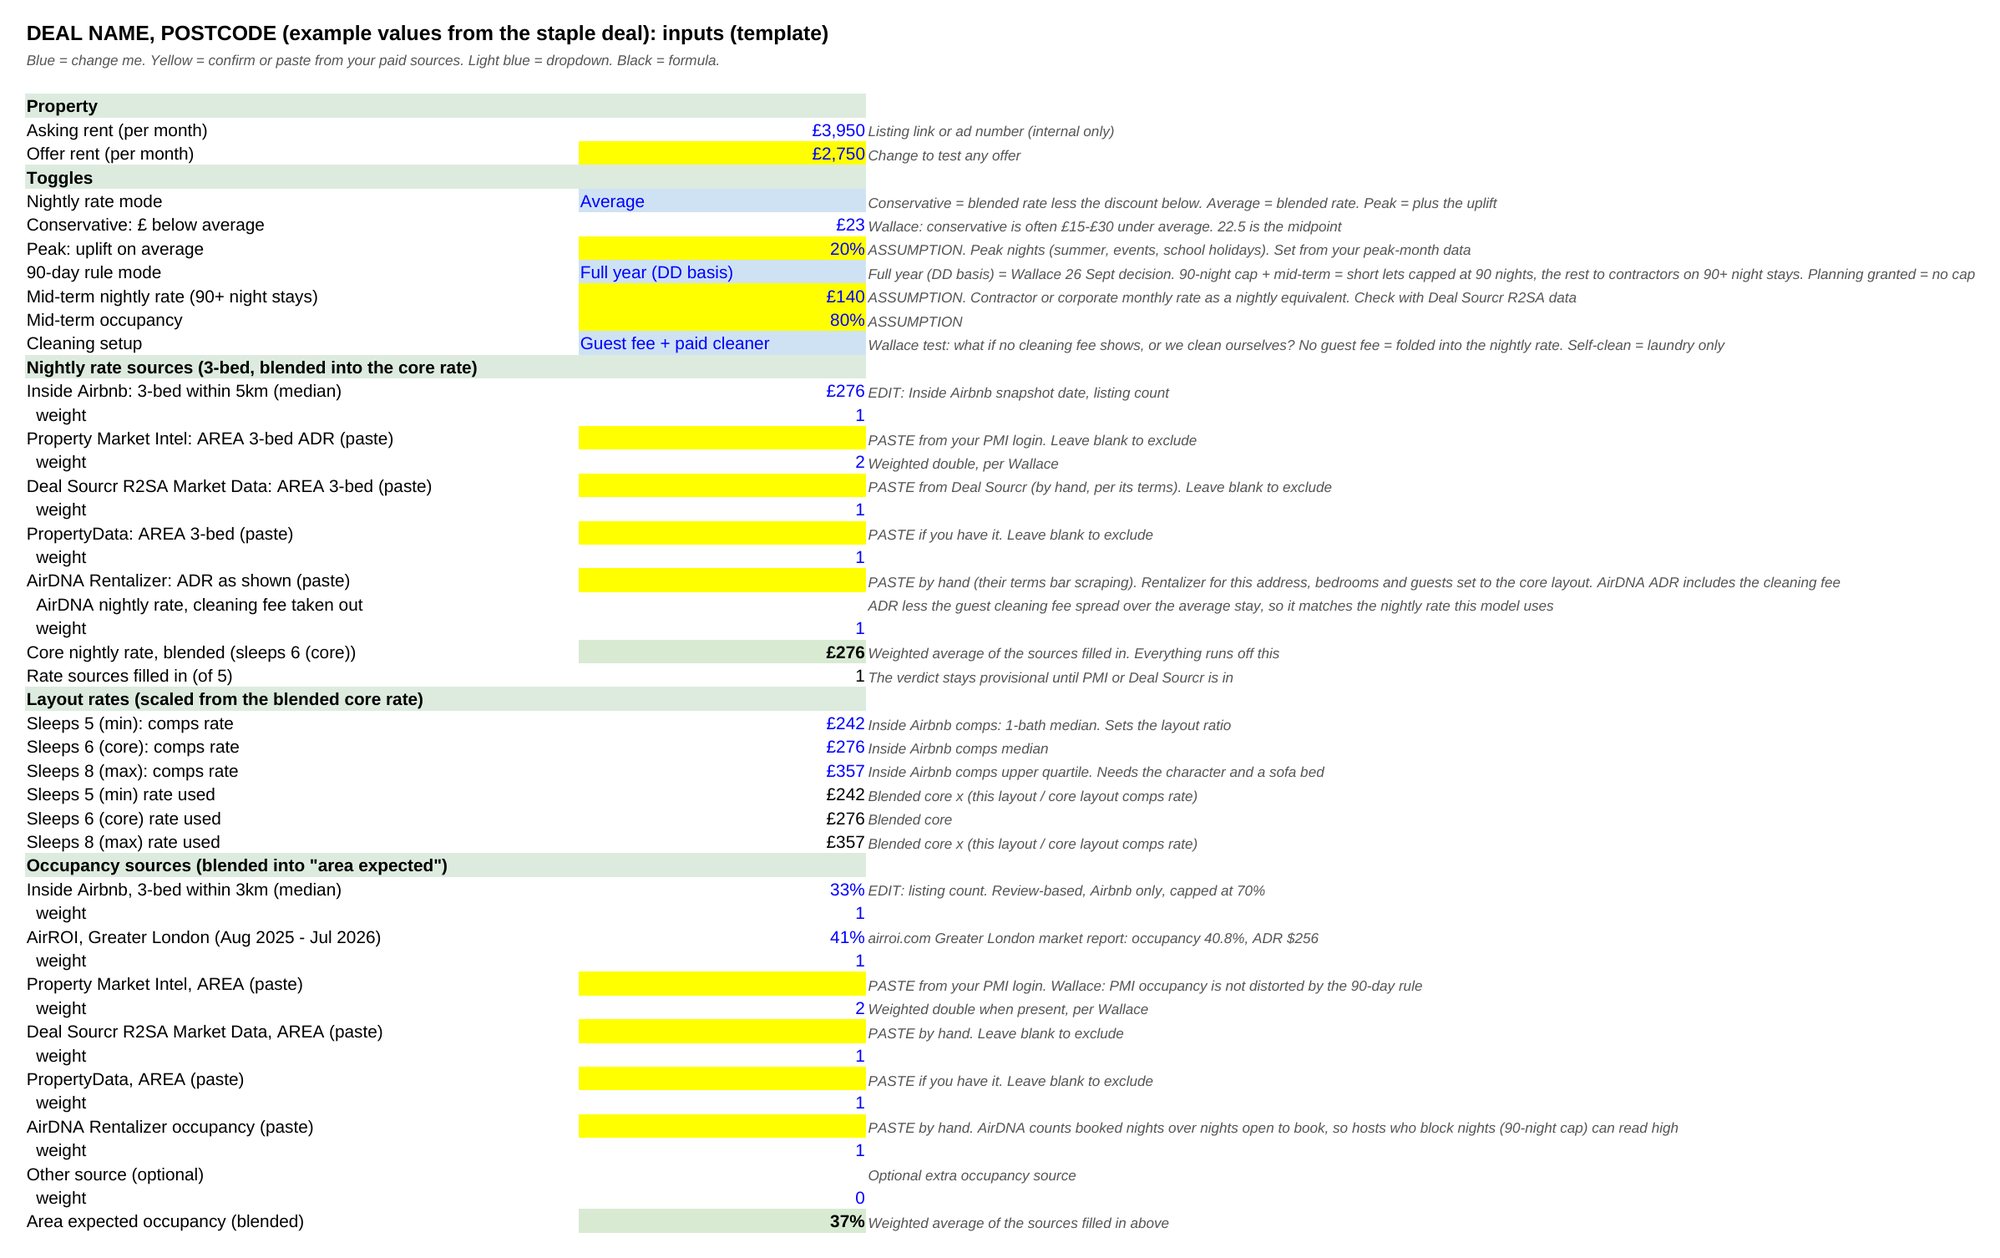
  • The Inputs tab: toggles, every nightly-rate and occupancy source with its weight, and a note against each assumption.
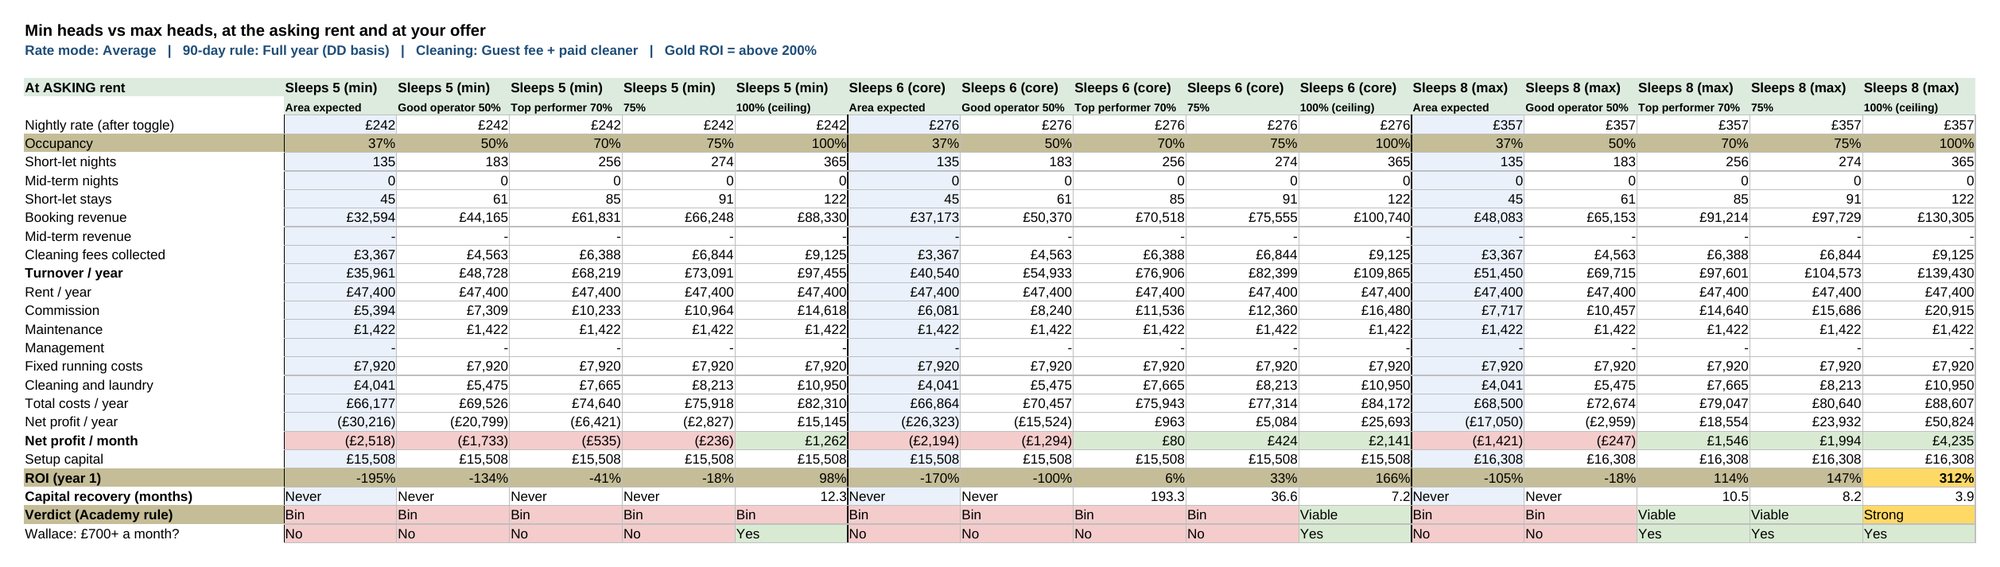
  • The Scenarios tab: fifteen cases side by side, three layouts at five occupancy levels, each with costs, profit, ROI, payback and a verdict.
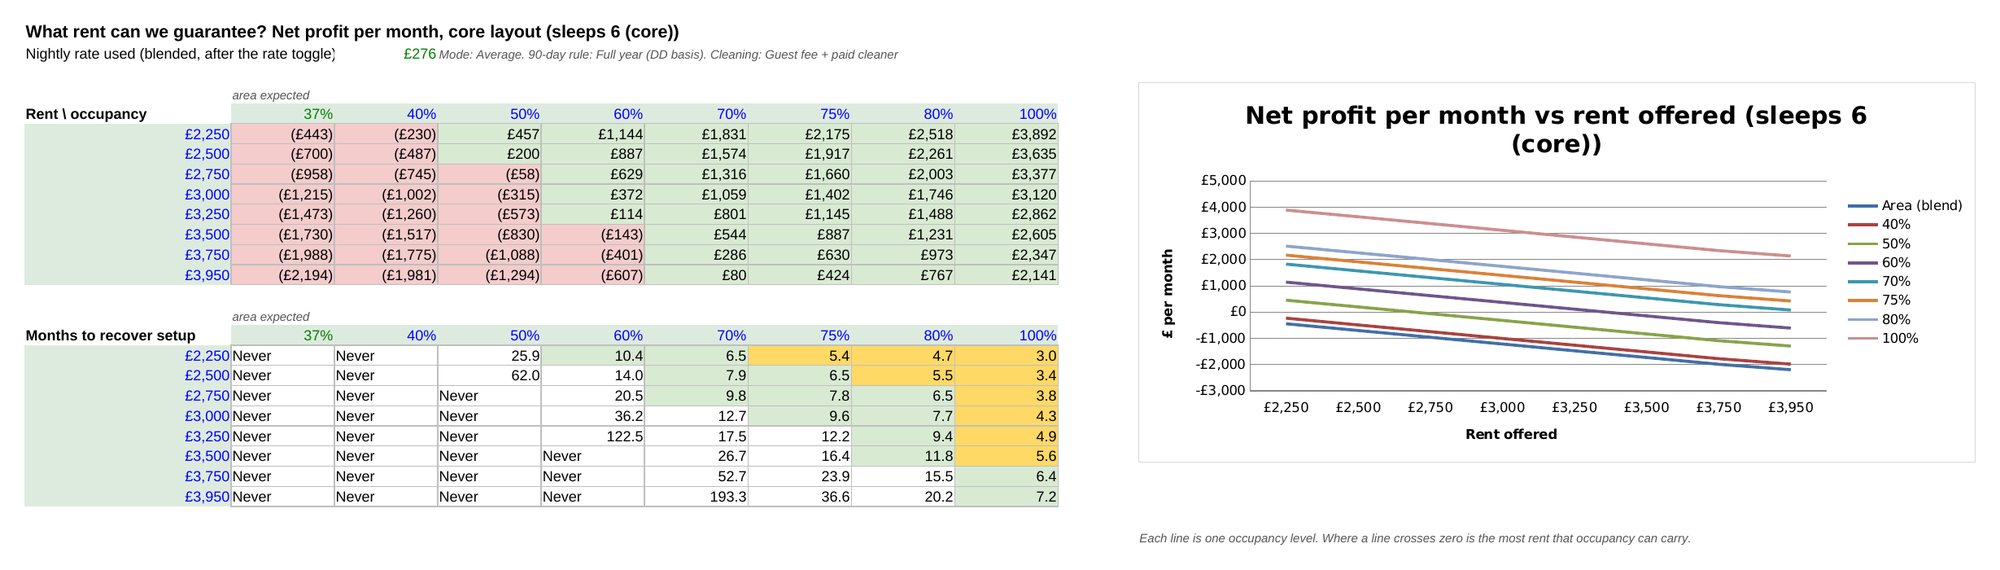
  • The Rent Offer Grid: net profit and months to recover setup for every rent from £2,250 to £3,950 at every occupancy, with a chart of profit against rent.
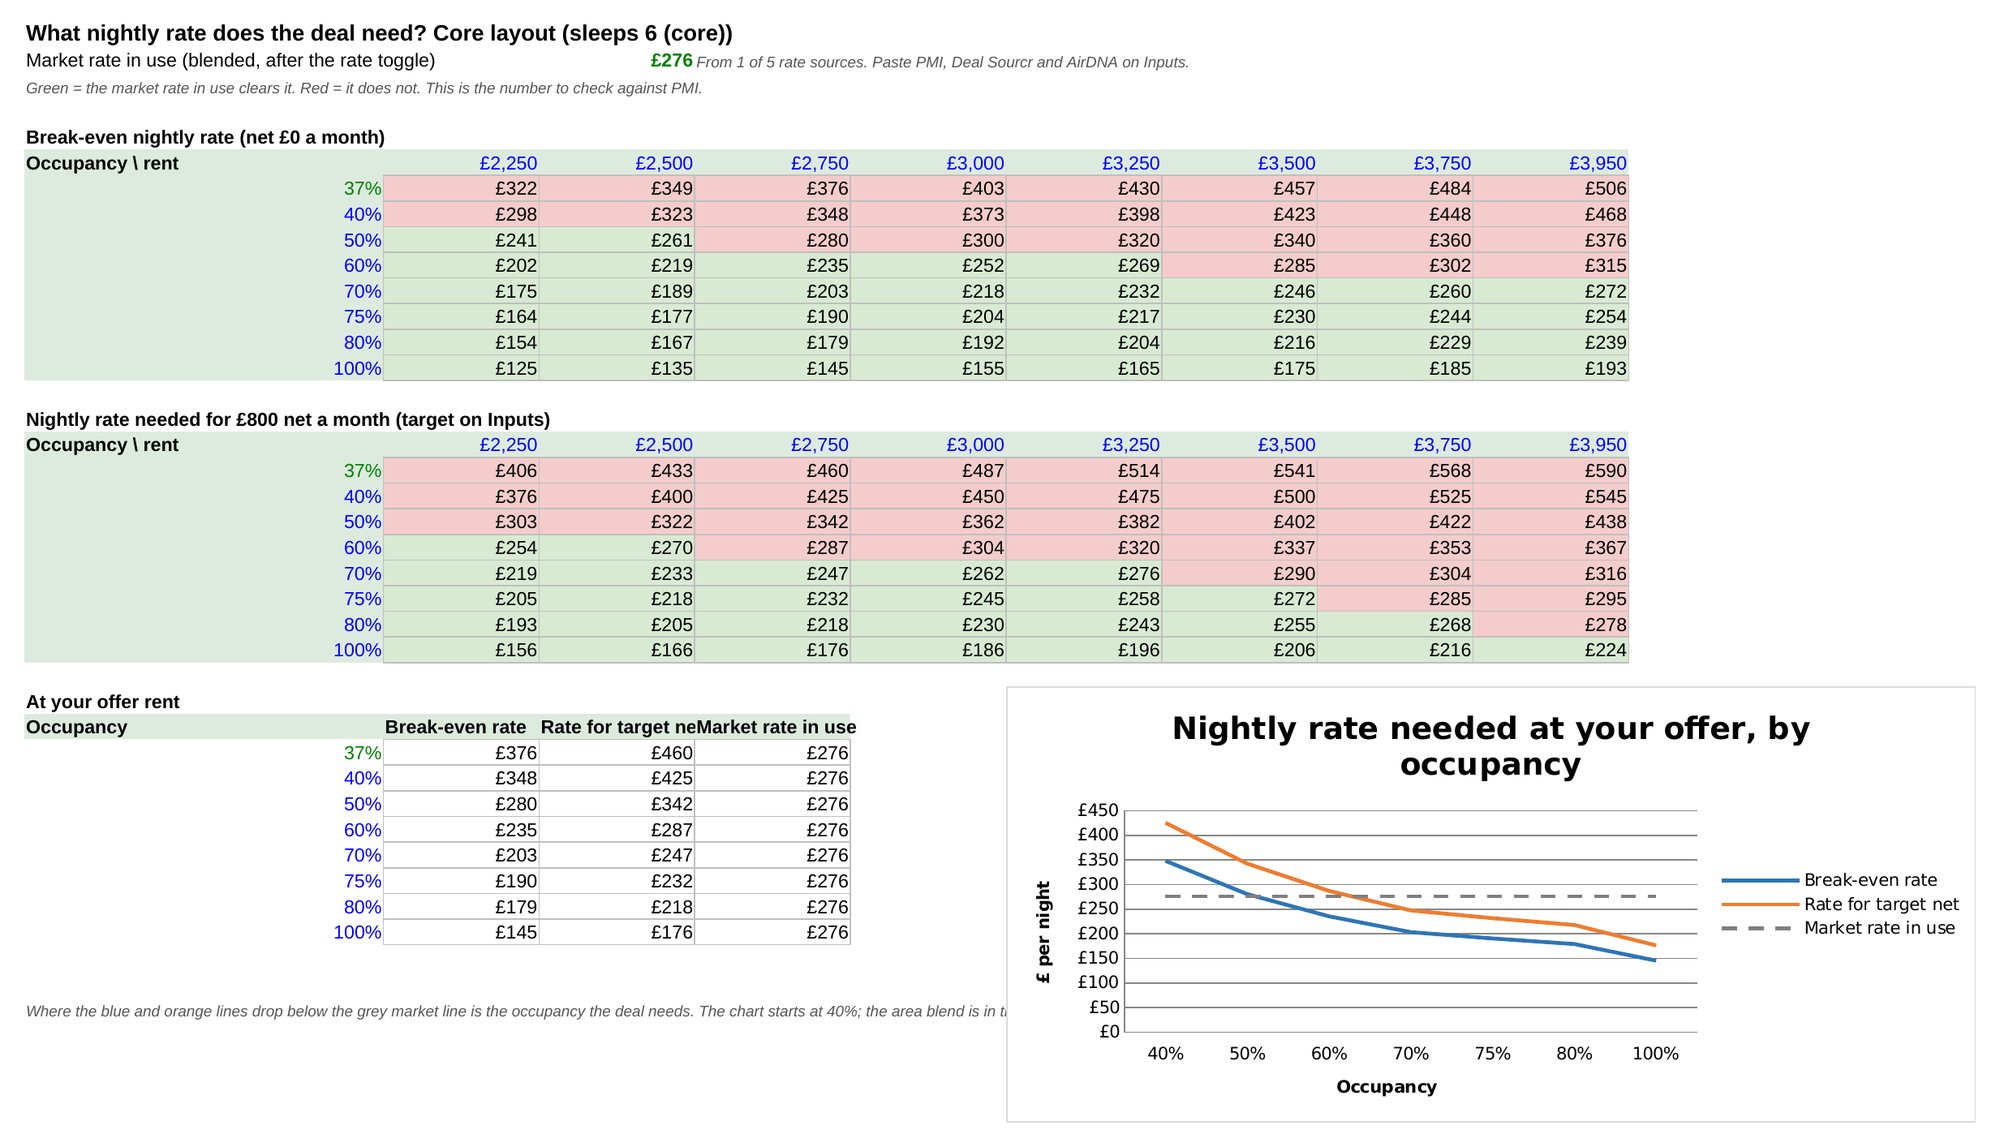
  • The break-even tab: the nightly rate the deal needs at each rent and occupancy, to break even and to clear a target profit, with a chart.
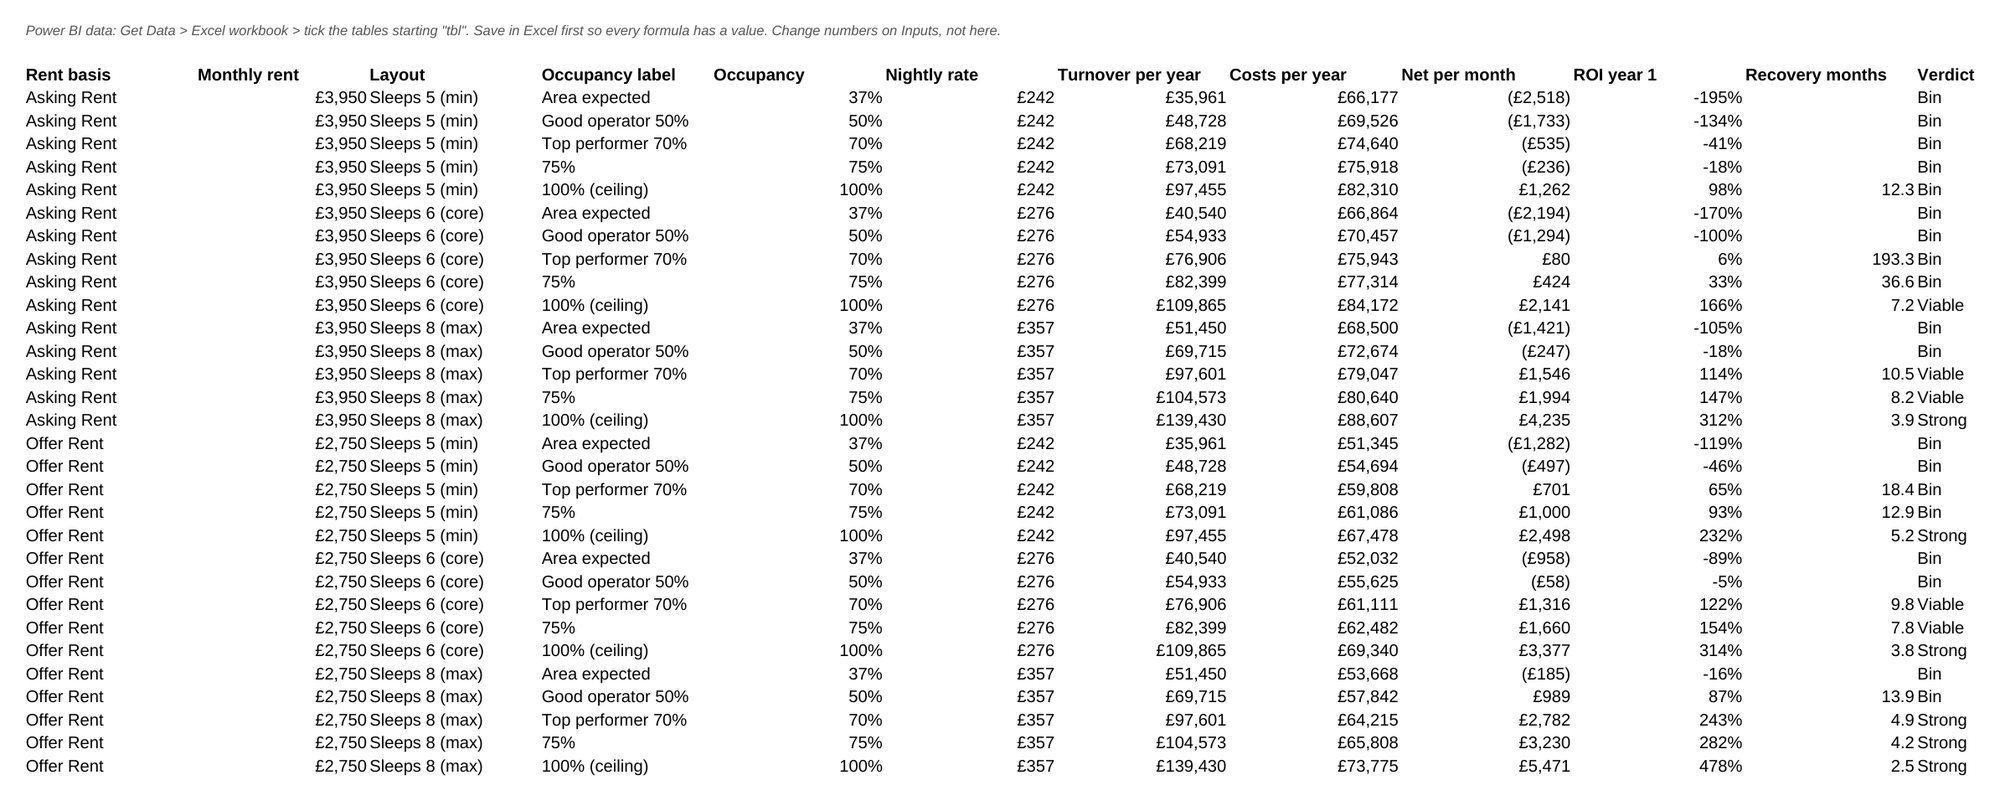
  • The Power BI data tab: every scenario as one tidy row, ready to load into a dashboard.
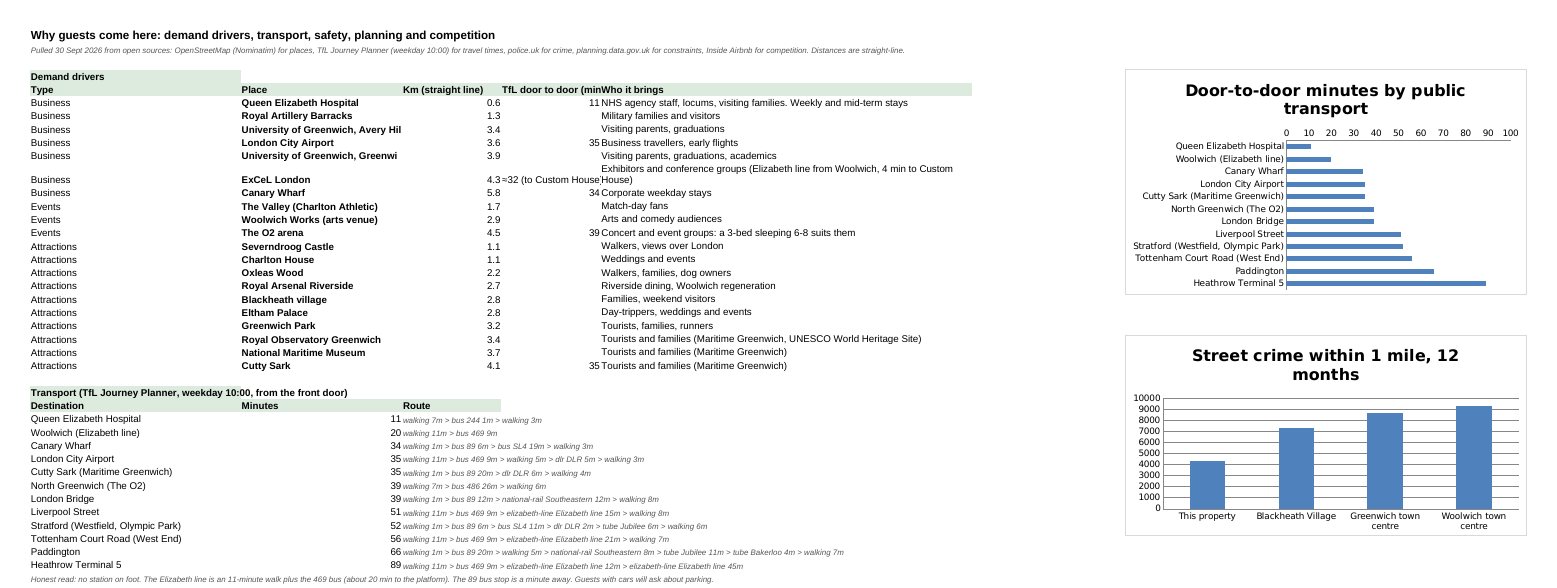
  • Location and demand from a real deal, anonymised: demand drivers with distances, door-to-door public transport times, and street-crime comparison charts, all pulled from open data.
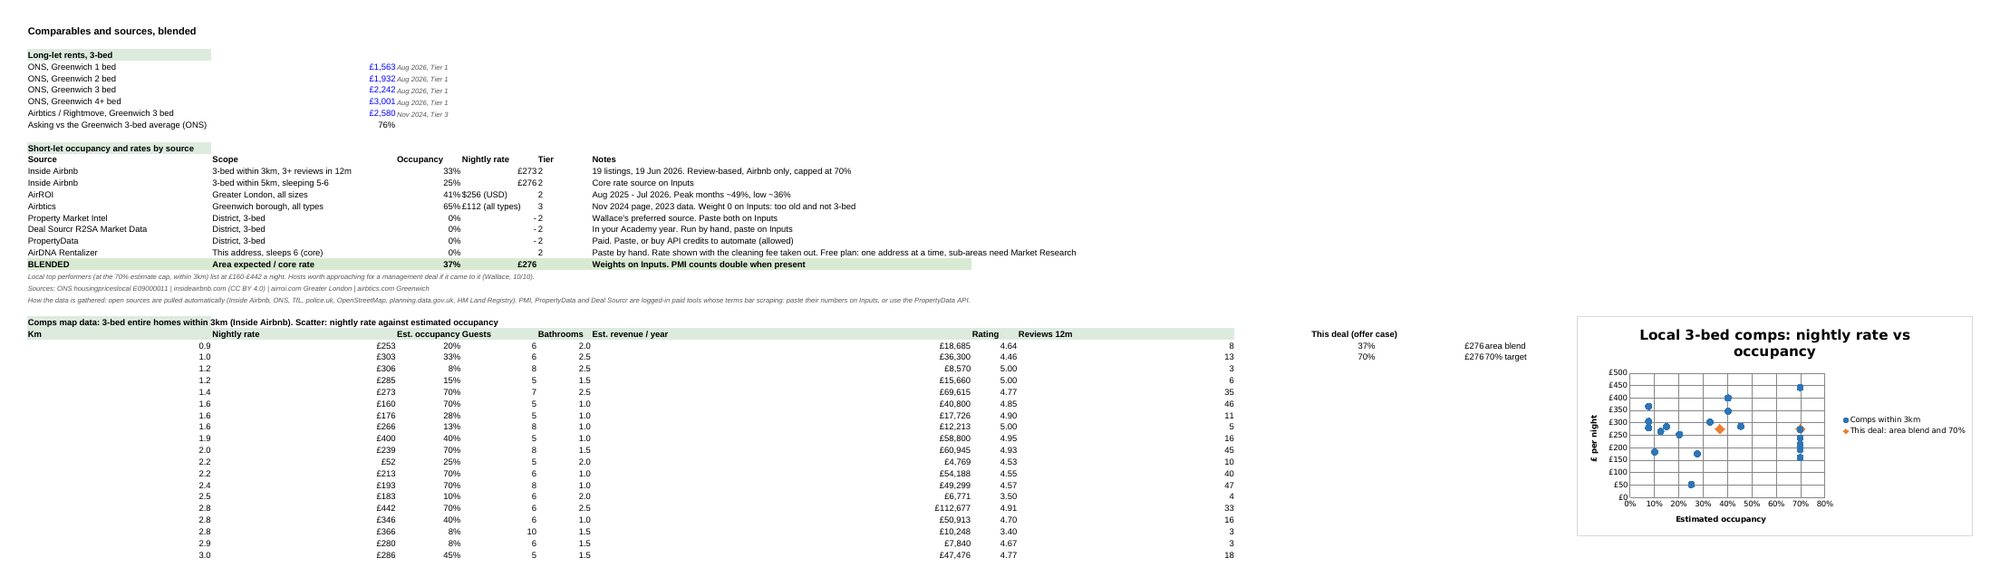
  • Comparables from a real deal, anonymised: long-let rents, short-let rate and occupancy sources blended with weights, and local comps plotted by nightly rate against occupancy.
1 / 9 · The What If tab: type any nightly rate and occupancy, example values

Tap a screenshot to open it full size. Template tabs show example values.

Try the model

“Change two numbers and the whole P&L answers back.”

£1,316Net a month
122%ROI, year one
9.8Months to recover setup
£203Break-even nightly rate
Viable: back within 12 months

Example 3-bed serviced apartment, using the template's defaults: 15% booking commission, 3% maintenance, £660 a month fixed costs, guest cleaning fee and paid cleaner, five weeks' deposit plus the first month, and £7,000 furnishing.

Case 2 · Data analysis

London, ranked.
Before looking.

9,934Short-let listings geocoded
ONSOfficial rents for every borough
~12Districts worth searching

Problem

Sourcing time went on listings that could never pass the numbers.

What I built

  • Listings matched to postcode districts through a geocoding API
  • Joined to official ONS rents
  • Every district run through the payback model, plus a stress test

Result

A ranked map with the most rent to search for in each district.

An open search became a shortlist.

A ladder chart of London postcode districts showing months to recover setup at the typical nightly rate, with a tail to the bottom-quarter rate.
Data: Inside Airbnb (CC BY 4.0), ONS Price Index of Private Rents, 2026
Case 3 · Operations and automation

One person.
Run like a team.

24Email rules from one script
4Jobs that run on a schedule
1Registry of every tool

Leads, email, compliance dates and follow-ups were spread across inboxes and notes, and things slipped. Now one system runs on a schedule, and a day with nothing new leaves everything as it was.

Inputs
Gmail: sent mail and replies
Lead pipeline and CRM
GOV.UK, Bank of England, Parliament
A 60-second daily log
On a schedule
10:00 dailyRefresh the dashboards, fill yesterday's tracker from the evidence
18:00 and 21:00One decided next action
1st of the monthPolicy radar, checked against official sources
On arrival24 email rules sort, flag or delete
Outputs
Call list ordered by value
Consistency score and weekly funnel
Dated radar of rule changes
One registry of every tool
Case 4 · Service design

An IT health check
for small organisations.

½ DAYOn site, one visit
5Cyber Essentials controls checked
2Read-only device scripts

Problem

Small firms, charities and churches pay for software they don't use, and keep files scattered across email, WhatsApp and personal drives.

What I built

  • An audit of access, software spend, files and devices
  • Device scripts for Windows and Mac
  • A report template with a savings line and a fixed-price fix

Result

A packaged service, ready for its first clients.

The Ford discipline, sized for small teams.

Case 5 · Offline by design

A sound-system map
for a festival with no signal.

37Sound systems and stages pinned
0 BARSNeeded once it’s loaded
1 TAPTo walking directions

Problem

At Notting Hill Carnival, mobile signal all but disappears. The official map is a poster image, so finding a sound system means guessing street corners in a crowd.

What I built

  • The official map with every sound system pinned and searchable
  • Pins calibrated to GPS from the poster’s own tube-station marks, so a blue dot shows where you are
  • One tap hands walking directions to Google or Apple Maps
  • Loads once, then works with no signal

Result

A one-page app that still works when the network doesn’t.

Built for the constraint, not around it.

Open the mapBest on a phone
Case 6 · Marketing funnel

A sign-up page
that builds a buyers list.

4Form fields, only email required
1List that every channel feeds
WEEKLYDeal email to the list

Problem

Sourced deals need buyers who are ready to move. Investor contacts were scattered across DMs, calls and notes, so every new deal started from zero.

What I built

  • A Mailchimp landing page and audience: name, email and phone, with only email required
  • Instagram, Facebook and WhatsApp all pointing to the same page
  • A weekly email of deals across London and the Home Counties

Result

One list of investors, so each week’s deals go to people who asked for them.

Buyers lined up before the deal lands.

See the pageA rebuilt demo: nothing you type is sent
How I work

“I design the system, set the rules and check the numbers.”

I work backwards from the outcome. Once I know what the project needs, I build the specific tool that moves it forward: a model, a script, a dashboard. I test it against known numbers, then hand it over ready to run. Efficient, direct, and no wasted steps.

EXCELVBAPOWER BIPYTHONPANDASREST APISGMAIL AUTOMATIONAI AGENTS
WALLACE ADELEYE · EXEMPLARY VALUES THROUGHOUT